Hypanel new feature release: resource monitoring
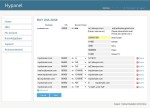
We’ve just updated Hypanel, our home baked VPS control panel, with the following new graphs:
- number of disk writes and reads
- data volume written and read to/from the disk
- bandwidth graph with in/out
- number of network packets in/out
- % CPU usage
- number of processes+threads
- number of used sockets
- send and receive TCP buffer (bytes)
- used kernel memory
All these are graphs and monitoring period can be customized per hour (current hour, last hour, 2 hours ago etc.), per day (today, yesterday, etc.) or per month.


